
High-performance liquid chromatography, better known as HPLC, sits at the center of peptide quality control. In laboratories around the world, scientists rely on HPLC data before a peptide ever touches a research project.
Purity numbers drive purchasing decisions, determine experimental reliability, and influence whether a study moves forward with confidence or caution.
Peptides may appear simple on paper, short chains of amino acids with precise sequences, yet verifying chemical identity and cleanliness requires a surprisingly refined analytical approach. HPLC provides that clarity.
Why Peptide Purity Matters in Research

Peptides serve as tools in drug development, receptor binding studies, signaling research, vaccine design, and a wide range of biochemical applications. Every experiment built around peptide activity assumes the material behaves exactly as intended.
Even small levels of contamination or incomplete synthesis can introduce competing biological effects, shift dose response curves, or lead to inconsistent outcomes between research groups. Purity data, therefore, becomes part of experimental design rather than a simple technical footnote.
Common consequences of low peptide purity include:
- Unexpected receptor activation
- Off-target binding
- Increased background noise in assays
- Poor reproducibility across experiments
- Incorrect conclusions drawn from flawed data
For research teams, purity verification forms part of risk management. HPLC plays a leading role in that verification.
Core Principles of HPLC in Peptide Analysis
HPLC separates compounds based on interactions between a mobile phase and a stationary phase inside a chromatographic column. Peptides traveling through that system separate according to size, polarity, charge distribution, and hydrophobic properties. Each compound exists in the column at a characteristic time known as the retention time.
A detector then records peaks corresponding to compounds present in the sample. The area under each peak correlates with the relative quantity.
For peptide work, reversed-phase HPLC remains the most common format. Columns packed with hydrophobic C18 material allow separation based on peptide hydrophobicity while mobile phases of water and organic solvent, usually acetonitrile, gradually elute compounds under controlled gradients.
Typical HPLC Setup for Peptide Purity Testing
Key System Components
| Component | Purpose |
| Solvent reservoirs | Hold the mobile phase liquids |
| High-pressure pump | Moves solvents through the column |
| Injector | Introduces the peptide sample |
| Column | Separates compounds |
| Detector | Measures absorbance or other signal |
| Data system | Converts a signal into a chromatogram |
Most peptide assays rely on ultraviolet detection, commonly monitoring absorbance at 214 nm or 220 nm, where peptide bonds absorb strongly.
Standard Mobile Phase Conditions
A common peptide method uses:
- Mobile Phase A: Water with 0.1 percent trifluoroacetic acid
- Mobile Phase B: Acetonitrile with 0.1 percent trifluoroacetic acid
- Gradient: Gradual increase of B over time
- Flow rate: 0.5 to 1.0 mL per minute, depending on the column
Small adjustments to solvent composition, gradient slope, and temperature fine-tune resolution for specific peptide sequences.
Reading a Peptide HPLC Chromatogram
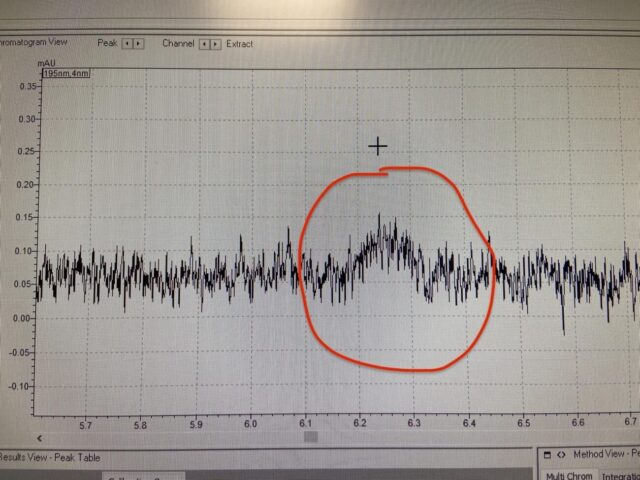
A chromatogram displays time on the horizontal axis and detector response on the vertical axis. Each visible peak represents a compound detected in the injected sample.
Main Peak Versus Impurities
The primary peak corresponds to the target peptide. Secondary peaks represent impurities, truncated sequences, side products from synthesis, degradation fragments, or residual protecting groups.
Purity percentage derives from peak integration:
Purity (%) = (Area of target peptide peak ÷ Total area of all detected peaks) × 100
Practical Example
Imagine a chromatogram with five peaks:
| Peak | Retention Time (min) | Area |
| 1 | 5.1 | 1,200 |
| 2 | 7.8 | 52,400 |
| 3 | 9.3 | 620 |
| 4 | 11.0 | 310 |
| 5 | 13.4 | 190 |
Peak 2 at 7.8 minutes represents the target peptide. Total area equals 54,720. Purity equals 52,400 ÷ 54,720 = 95.8 percent.
In many research applications, purity above 95 percent remains acceptable. Certain clinical development programs require 98 percent or higher.
Why Retention Time Matters
Retention time offers confirmation of chemical identity. Each peptide elutes at a reproducible time under consistent conditions. Matching retention time against reference standards supports the correct identification of the target molecule.
However, retention time alone never proves identity. Mass spectrometry frequently complements HPLC for full structural confirmation.
Limitations of HPLC in Peptide Purity Testing

HPLC reveals relative purity based on detected peaks, though certain limitations deserve attention:
- Impurities lacking UV absorbance remain invisible
- Co-eluting compounds may overlap under poor separation conditions
- Similar peptides with near-identical hydrophobicity may not resolve fully
- Very small impurities may fall below the detection threshold
Experienced analysts design methods carefully to minimize such blind spots.
Role of Sample Preparation
Sample preparation influences chromatographic performance more than many researchers realize.
Peptide samples often undergo:
- Dissolution in a compatible solvent
- Filtration to remove particulates
- Dilution to the appropriate concentration
- Degassing to prevent bubble formation
Improper preparation can distort peak shapes, cause baseline noise, or introduce artificial impurities.
Gradient Design and Resolution Control

Gradient slope controls separation quality. A shallow gradient enhances resolution between closely related species. A steep gradient shortens run time while sacrificing separation.
Analysts choose gradients based on:
- Peptide hydrophobicity profile
- Expected impurity complexity
- Required sensitivity
- Throughput requirements
Temperature also affects resolution. Elevated column temperatures often sharpen peaks and improve reproducibility.
HPLC Purity in Commercial Peptide Supply
Reliable peptide suppliers provide HPLC certificates of analysis for each batch. Reports include chromatograms, purity percentage, method conditions, and retention times.
Midway through procurement processes, many research teams compare suppliers using HPLC documentation.
One such resource in peptide sourcing involves vendors like Iron Peptides, where detailed analytical reports often accompany product listings, allowing buyers to review purity metrics before placing orders.
Such transparency assists laboratories in selecting materials aligned with project requirements.
What Appears on an HPLC Certificate of Analysis
A typical report includes:
| Section | Information |
| Sample ID | Batch number, peptide sequence |
| Method | Column type, solvents, gradient |
| Detection | Wavelength, flow rate |
| Chromatogram | Visual output |
| Purity | Calculated percentage |
| Analyst signature | Verification |
Additional pages may include mass spectrometry data or stability testing.
Choosing Purity Levels for Specific Research Goals
Different applications tolerate varying purity thresholds.
Exploratory Research
Early-stage assays often proceed with 90 to 95 percent purity when screening biological activity or mapping binding interactions.
Mechanistic Studies
Work involving detailed receptor modeling or pathway analysis benefits from 95 to 98 percent purity to minimize confounding signals.
Preclinical Development
Drug candidate peptides typically require 98 percent or higher purity along with extensive analytical documentation.
Clinical Grade Material
Human studies demand extremely tight specifications, validated methods, and regulatory compliance.
Stability and Degradation Considerations
HPLC monitors purity at the time of analysis. Storage conditions affect stability long after initial testing. Peptides degrade through hydrolysis, oxidation, aggregation, and light exposure.
Regular reanalysis by HPLC confirms ongoing integrity during long-term projects. Comparing chromatograms over time reveals emerging degradation peaks before biological effects become noticeable.
Complementary Analytical Techniques
While HPLC serves as the workhorse of peptide purity assessment, laboratories often combine it with:
- Mass spectrometry for molecular weight confirmation
- Amino acid analysis for composition verification
- Capillary electrophoresis for charge separation
- NMR spectroscopy for structural confirmation
Together, such tools build a robust analytical profile.
Real World Example from Peptide Development
A biotech group investigating a peptide agonist observed inconsistent receptor activation across experiments. Initial HPLC showed 96 percent purity, seemingly acceptable. Later method refinement improved separation and revealed a previously unresolved impurity co-eluting under the main peak.
After purification adjustments, HPLC purity rose above 99 percent. Biological variability dropped sharply, and dose-response curves stabilized.
Analytical resolution directly influenced experimental success.
Interpreting Purity Claims Critically
Purity percentages lack meaning without method context. A 99 percent result from a poor separation method offers less confidence than a 96 percent result from a highly resolved chromatogram.
Critical review focuses on:
- Chromatogram clarity
- Baseline separation between peaks
- Detection wavelength suitability
- Presence of unknown peaks
Smart buyers request full reports rather than summary numbers.
Future Trends in Peptide Analytics
Emerging technologies enhance HPLC performance:
- Ultra-high-pressure systems improve resolution
- Core-shell particle columns sharpen peaks
- Automated method development accelerates optimization
- Coupled MS detection enables real-time identification
Peptide science advances alongside analytical chemistry.
Conclusion
HPLC remains the cornerstone of peptide purity measurement in research. Every chromatogram tells a story about chemical quality, synthesis success, and experimental reliability.
Laboratories that treat HPLC data with care gain clearer results, stronger reproducibility, and higher confidence in scientific conclusions.


